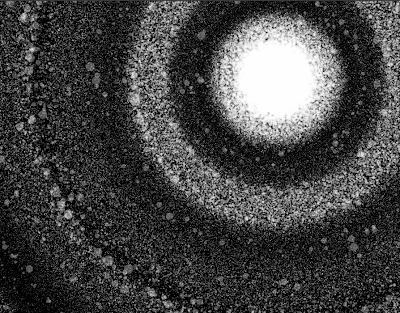
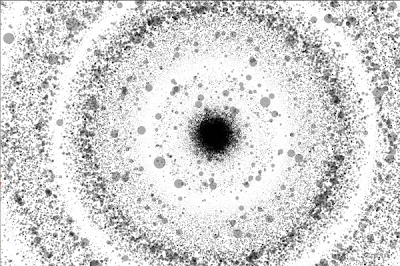
The invert result is great, but to me it works more well with the other tones. It's felt more deeper with white stars. But this is still a good result.
MDDN242 - COMPUTER GRAPHICS PRODUCTION
Wednesday, 16 May 2012
TRIAL WITH THE INVERT THEME COLOUR
SCREENSHOTS OF PROJECT 2
I chose black and white because of it provides more contrast than any colours, the outcome is magnificent.
Submission 242 - Project 2
Here is my final submission for Project 2
CODE
-------------------------------------------------------------------------------------------------------------------------------------
import math
XRES = 900 ##WIDTH is 900
YRES = 700 ##HEIGHT is 700
centerX = random(XRES/2-200,XRES-200) ##Center of the planet (random between the middle of the sketch to 200 units around)
centerY = random(YRES/2-200,YRES-200)
def setup(): ##Setup sketch
size(XRES, YRES)
background(0) ##Black BG
noStroke()
fill(255,255,255,80) ##White colour, 80 alpha
smooth()
randata = [] ##list randata
for i in range(XRES): ##size of the circle random
randata = randata + [random(-150.,150.)]
def plot(data, yoff): ##Star Contributor : random in a circle
for i in range(1, XRES):
angle = random(0.,PI*2)
x = i*1.618*sin(angle) ##golden ratio applied
y = i*1.618*cos(angle)
ellipse(centerX+x,centerY+y,data[i]/5,data[i]/5) ##main circles make the galaxy
ellipse(centerX+2*x,centerY+2*y,data[i]/7,data[i]/7) ##smaller circles make it more interesting
def filter(data):
for i in range(1,XRES-1):
data[i]=0.5*(data[i-1] + data[i+1]) ##Median filter for data
def draw():
filter(randata)
if (4*frameCount)<(2500): ##the amount of circles and speed of the sketch
plot(randata, 4*frameCount)
-------------------------------------------------------------------------------------------------------------------------------------
MORE TRIALS TO GET MORE INTERESTING
From the previous trial with circles, I found it was very interesting to create something like a huge system like the underwater world with bubbles or.... maybe a galaxy. Yeah, should do it.
Comment : Tried with the alpha on black colours to blend out the circles, also applied one more ellipse function to draw the ring around a specific center. The outcome is magnificent, looked so much like a galaxy with a big planet at the center.
CODE :
------------------------------------------------------------------------------------------------------------------
import math
XRES = 600
YRES = 400
centerX = random(XRES/2,XRES)
centerY = random(YRES/2,YRES)
def setup():
size(XRES, YRES)
background(255)
noStroke()
fill(0,0,0,80)
smooth()
randata = []
for i in range(XRES):
randata = randata + [random(-100.,100.)]
def plot(data, yoff):
for i in range(1, XRES):
angle = random(0.,PI*2)
x = i*1.618*sin(angle)
y = i*1.618*cos(angle)
ellipse(centerX+x,centerY+y,data[i]/4,data[i]/4)
def filter(data):
for i in range(1,XRES-1):
data[i]=0.5*(data[i-1] + data[i+1])
def draw():
filter(randata)
if (2*frameCount)<(800):
plot(randata, 2*frameCount)
------------------------------------------------------------------------------------------------------------------
Now I was trying with more frameCount to get more circles, so I cranked it up into 2000 instead of 800. The number would cause a crash though, but would worth a try as well .
Comment : The outcome is great, but I thought it was a bit too off focus there. The black took lots of spaces, made it look like a black hole rather than a galaxy. Also to point out the tiny circles, I tried to tweak a little bit with the second "ellipse" function to get much smaller stars.
CODE :
------------------------------------------------------------------------------------------------------------------
import math
XRES = 600
YRES = 400
centerX = random(XRES/2,XRES-200)
centerY = random(YRES/2,YRES-200)
def setup():
size(XRES, YRES)
background(255)
noStroke()
fill(0,0,0,80)
smooth()
randata = []
for i in range(XRES):
randata = randata + [random(-150.,150.)]
def plot(data, yoff):
for i in range(1, XRES):
angle = random(0.,PI*2)
x = i*1.618*sin(angle)
y = i*1.618*cos(angle)
ellipse(centerX+x,centerY+y,data[i]/4,data[i]/4)
ellipse(centerX+2*x,centerY+2*y,data[i]/4,data[i]/4)
def filter(data):
for i in range(1,XRES-1):
data[i]=0.5*(data[i-1] + data[i+1])
def draw():
filter(randata)
if (2*frameCount)<(2000):
plot(randata, 2*frameCount)
------------------------------------------------------------------------------------------------------------------
I thought I should have gone back a bit with the amount of circles as well as the radius.
Comment : Much smaller black center, the rings out side is clearly shaped. The outcome is awesome, I like it.
CODE :
------------------------------------------------------------------------------------------------------------------
import math
XRES = 600
YRES = 400
centerX = random(XRES/2,XRES-200)
centerY = random(YRES/2,YRES-200)
def setup():
size(XRES, YRES)
background(255)
noStroke()
fill(0,0,0,80)
smooth()
randata = []
for i in range(XRES):
randata = randata + [random(-150.,150.)]
def plot(data, yoff):
for i in range(1, XRES):
angle = random(0.,PI*2)
x = i*1.618*sin(angle)
y = i*1.618*cos(angle)
ellipse(centerX+x,centerY+y,data[i]/5,data[i]/5)
ellipse(centerX+2*x,centerY+2*y,data[i]/7,data[i]/7)
def filter(data):
for i in range(1,XRES-1):
data[i]=0.5*(data[i-1] + data[i+1])
def draw():
filter(randata)
if (4*frameCount)<(2000):
plot(randata, 4*frameCount)
------------------------------------------------------------------------------------------------------------------
I just found the problem I got here was the center of my galaxy just randomly placed to the right of the sketch. So I tried to figure out the way to make this right. Putting a negative number in the random in the sketch would help. Also I tweaked the size of the sketch to get more stars in a sketch, I thought it would be more interesting though.
Comment : The ring is random as well. However the ring is pleasure to me already.
CODE :
------------------------------------------------------------------------------------------------------------------
import math
XRES = 900
YRES = 700
centerX = random(XRES/2,XRES-200)
centerY = random(YRES/2,YRES-200)
def setup():
size(XRES, YRES)
background(255)
noStroke()
fill(0,0,0,80)
smooth()
randata = []
for i in range(XRES):
randata = randata + [random(-150.,150.)]
def plot(data, yoff):
for i in range(1, XRES):
angle = random(0.,PI*2)
x = i*1.618*sin(angle)
y = i*1.618*cos(angle)
ellipse(centerX+x,centerY+y,data[i]/5,data[i]/5)
ellipse(centerX+2*x,centerY+2*y,data[i]/7,data[i]/7)
def filter(data):
for i in range(1,XRES-1):
data[i]=0.5*(data[i-1] + data[i+1])
def draw():
filter(randata)
if (4*frameCount)<(2500):
plot(randata, 4*frameCount)
------------------------------------------------------------------------------------------------------------------
TRIALS WITH HARDER FILTER AND RANDOM IN CIRCLE
I stepped one more step to more complicated codes like random in circle and more advanced filtered random.
Comment : The outcome is great, so random and fulfill. More interesting with these codes.
CODE :
------------------------------------------------------------------------------------------------------------------
import math
XRES = 600
YRES = 400
centerX = XRES/2
centerY = YRES/2
npts = 400
def setup():
size(XRES, YRES)
background(255)
stroke(0)
smooth()
randata = []
for i in range(XRES):
randata = randata + [random(-100.,100.)]
def plot(data, yoff):
for i in range(1, XRES):
angle = PI*2
x = i*1.618*sin(angle)
y = i*1.618*cos(angle)
line(x,y,i,yoff+data[i])
def filter(data):
for i in range(1,XRES-1):
data[i]=0.9*(data[i-1] + data[i+1])
def draw():
filter(randata)
if (40*frameCount)<(YRES+200):
plot(randata, 40*frameCount)
------------------------------------------------------------------------------------------------------------------
Then I tried smaller amount on filtering like (0.5-0.6) the multiply the frameCount with 50.
Comment : The outcome is much crazier. The lines are filling all the blank on the sketch, and making really crazy net.
CODE :
------------------------------------------------------------------------------------------------------------------
import math
XRES = 600
YRES = 400
centerX = XRES/2
centerY = YRES/2
npts = 400
def setup():
size(XRES, YRES)
background(255)
stroke(0)
smooth()
randata = []
for i in range(XRES):
randata = randata + [random(-100.,100.)]
def plot(data, yoff):
for i in range(1, XRES):
angle = random(0.,PI*2)
x = i*1.618*sin(angle)
y = i*1.618*cos(angle)
line(centerX+x,centerY+y,i/250,yoff+data[i])
def filter(data):
for i in range(1,XRES-1):
data[i]=0.5*(data[i-1] + data[i+1])
def draw():
filter(randata)
if (50*frameCount)<(YRES+200):
plot(randata, 50*frameCount)
------------------------------------------------------------------------------------------------------------------
The previous trial was crazy, but that with lines I wonder why not using ellipse shapes?
Comment : This is an amazing outcome. Circles by circles, somehow I felt like I was 10k feet under the water where lots of bubbles surrounding me.
CODE :
------------------------------------------------------------------------------------------------------------------
import math
XRES = 600
YRES = 400
centerX = XRES/2
centerY = YRES/2
npts = 400
def setup():
size(XRES, YRES)
background(255)
stroke(0)
smooth()
randata = []
for i in range(XRES):
randata = randata + [random(-100.,100.)]
def plot(data, yoff):
for i in range(1, XRES):
angle = random(0.,PI*2)
x = i*1.618*sin(angle)
y = i*1.618*cos(angle)
ellipse(centerX+x,centerY+y,data[i],data[i])
def filter(data):
for i in range(1,XRES-1):
data[i]=0.5*(data[i-1] + data[i+1])
def draw():
filter(randata)
if (50*frameCount)<(YRES+200):
plot(randata, 50*frameCount)
------------------------------------------------------------------------------------------------------------------
MORE UNDERSTANDING ON CODES
I got some ideas how these codes works, so I started to tweak as my pleasant.
At the very first, I tried with filtered random, tried to fix some numbers to get more interesting results.
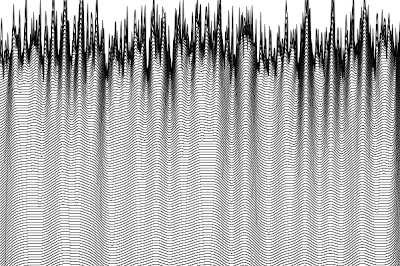
Comment : Crazy waves caused from filter and random. Interesting.
CODE :
------------------------------------------------------------------------------------------------------------------
XRES = 600
YRES = 400
def setup():
size(XRES, YRES)
background(255)
stroke(0)
smooth()
randata = []
for i in range(XRES):
randata = randata + [random(-50.,150.)]
def plot(data, yoff):
for i in range(1, XRES):
line(i-1,yoff+data[i-1],i,yoff+data[i])
def filter(data):
for i in range(1,XRES-1):
data[i]=0.5*(data[i-1] + data[i+1])
def draw():
filter(randata)
if (4*frameCount)<(YRES+100):
plot(randata, 4*frameCount)
------------------------------------------------------------------------------------------------------------------
What if I tried with another shapes instead of using lines? Here with the circles
Comment : Looks crazy, I love this.
CODE :
------------------------------------------------------------------------------------------------------------------
XRES = 600
YRES = 400
def setup():
size(XRES, YRES)
background(255)
stroke(0)
smooth()
randata = []
for i in range(XRES):
randata = randata + [random(-200.,200.)]
def plot(data, yoff):
for i in range(1, XRES):
ellipse(i-1,yoff+data[i-1],i,yoff+data[i])
def filter(data):
for i in range(1,XRES-1):
data[i]=0.5*(data[i-1] + data[i+1])
def draw():
filter(randata)
if (40*frameCount)<(YRES+100):
plot(randata, 40*frameCount)
------------------------------------------------------------------------------------------------------------------
And trial with rectangle
Comment : Hierarchy indeed, but not my types of art. Good trial to understand more on codes though.
CODE :
------------------------------------------------------------------------------------------------------------------
XRES = 600
YRES = 400
def setup():
size(XRES, YRES)
background(255)
stroke(0)
smooth()
randata = []
for i in range(XRES):
randata = randata + [random(-200.,200.)]
def plot(data, yoff):
for i in range(1, XRES):
rect(i-1,yoff+data[i-1],i,yoff+data[i])
def filter(data):
for i in range(1,XRES-1):
data[i]=0.5*(data[i-1] + data[i+1])
def draw():
filter(randata)
if (40*frameCount)<(YRES+100):
plot(randata, 40*frameCount)
------------------------------------------------------------------------------------------------------------------
EXAMPLES BY EXAMPLES
I was bit slow at understanding all of the random codes, so I tried almost the examples from the "random" lecture PDF files.
Example 1 :
Comment : In linear form, the simplest one.
CODE :
-----------------------------------------------------------------------------------------------------------------
XRES = 600
YRES = 600
CX = XRES/2
CY = YRES/2
npts = 5000
import math
def setup():
size(XRES,YRES)
background(255)
stroke(0,10)
smooth()
noLoop()
def draw():
for i in range(npts):
r = CX + random(-200,200)
line(r,CY-100,r,CY+100)
-----------------------------------------------------------------------------------------------------------------
Example 2 :
Comment : Just applied list in and get a slightly different result from the first one.
CODE :
-----------------------------------------------------------------------------------------------------------------
XRES = 600
YRES = 600
CX = XRES/2
CY = YRES/2
npts = 5000
buckets = [0.]
buckets = buckets*XRES
def setup():
size(XRES, YRES)
background(255)
stroke(0,10)
smooth()
noLoop()
def draw():
for i in range(npts):
r = CX + random(-200,200)
line(r,CY-100,r,CY+100)
ir = int(r)
buckets[ir] = buckets[ir] + 1
stroke(0)
for i in range (XRES):
line(i,CY-200,i,CY-200-buckets[i])
-----------------------------------------------------------------------------------------------------------------
Example 3 :
Comment : Still the same as the second one but with a gradient effect.
CODE :
-----------------------------------------------------------------------------------------------------------------
XRES = 600
YRES = 600
CX = XRES/2
CY = YRES/2
npts = 5000
buckets = [0.]
buckets = buckets*XRES
def setup():
size(XRES, YRES)
background(255)
stroke(0,10)
smooth()
noLoop()
def draw():
for i in range(npts):
r = CX
for j in range(12): r = r + random(-50,50)
line(r,CY-100,r,CY+100)
stroke(0)
for i in range(XRES):
line(i, CY-200, i, CY-200-buckets[i])
-----------------------------------------------------------------------------------------------------------------
Subscribe to:
Comments (Atom)


