Wednesday 16 May 2012

TRIAL WITH THE INVERT THEME COLOUR


The invert result is great, but to me it works more well with the other tones. It's felt more deeper with white stars. But this is still a good result.

SCREENSHOTS OF PROJECT 2


I chose black and white because of it provides more contrast than any colours, the outcome is magnificent.

Submission 242 - Project 2

Here is my final submission for Project 2

CODE
-------------------------------------------------------------------------------------------------------------------------------------

import math

XRES = 900 ##WIDTH is 900
YRES = 700 ##HEIGHT is 700
centerX = random(XRES/2-200,XRES-200) ##Center of the planet (random between the middle of the sketch to 200 units around)
centerY = random(YRES/2-200,YRES-200)

def setup(): ##Setup sketch
size(XRES, YRES)
background(0) ##Black BG
noStroke()
fill(255,255,255,80) ##White colour, 80 alpha
smooth()

randata = [] ##list randata
for i in range(XRES): ##size of the circle random
randata = randata + [random(-150.,150.)]

def plot(data, yoff): ##Star Contributor : random in a circle
for i in range(1, XRES):
angle = random(0.,PI*2)
x = i*1.618*sin(angle) ##golden ratio applied
y = i*1.618*cos(angle)
ellipse(centerX+x,centerY+y,data[i]/5,data[i]/5) ##main circles make the galaxy
ellipse(centerX+2*x,centerY+2*y,data[i]/7,data[i]/7) ##smaller circles make it more interesting

def filter(data):
for i in range(1,XRES-1):
data[i]=0.5*(data[i-1] + data[i+1]) ##Median filter for data

def draw():
filter(randata)
if (4*frameCount)<(2500): ##the amount of circles and speed of the sketch
plot(randata, 4*frameCount)
-------------------------------------------------------------------------------------------------------------------------------------

MORE TRIALS TO GET MORE INTERESTING

From the previous trial with circles, I found it was very interesting to create something like a huge system like the underwater world with bubbles or.... maybe a galaxy. Yeah, should do it.

Comment : Tried with the alpha on black colours to blend out the circles, also applied one more ellipse function to draw the ring around a specific center. The outcome is magnificent, looked so much like a galaxy with a big planet at the center.
CODE :
------------------------------------------------------------------------------------------------------------------
 import math

XRES = 600
YRES = 400
centerX = random(XRES/2,XRES)
centerY = random(YRES/2,YRES)

def setup():
    size(XRES, YRES)
    background(255)
    noStroke()
    fill(0,0,0,80)
    smooth()
  
randata = []
for i in range(XRES):
    randata = randata + [random(-100.,100.)]
  
def plot(data, yoff):
    for i in range(1, XRES):
        angle = random(0.,PI*2)
        x = i*1.618*sin(angle)
        y = i*1.618*cos(angle)
        ellipse(centerX+x,centerY+y,data[i]/4,data[i]/4)
      
def filter(data):
    for i in range(1,XRES-1):
        data[i]=0.5*(data[i-1] + data[i+1])
                          
      
def draw():
    filter(randata)
    if (2*frameCount)<(800):
        plot(randata, 2*frameCount)
------------------------------------------------------------------------------------------------------------------

Now I was trying with more frameCount to get more circles, so I cranked it up into 2000 instead of 800. The number would cause a crash though, but would worth a try as well .

Comment : The outcome is great, but I thought it was a bit too off focus there. The black took lots of spaces, made it look like a black hole rather than a galaxy. Also to point out the tiny circles, I tried to tweak a little bit with the second "ellipse" function to get much smaller stars.

CODE :
------------------------------------------------------------------------------------------------------------------
 import math

XRES = 600
YRES = 400
centerX = random(XRES/2,XRES-200)
centerY = random(YRES/2,YRES-200)

def setup():
    size(XRES, YRES)
    background(255)
    noStroke()
    fill(0,0,0,80)
    smooth()
  
randata = []
for i in range(XRES):
    randata = randata + [random(-150.,150.)]
  
def plot(data, yoff):
    for i in range(1, XRES):
        angle = random(0.,PI*2)
        x = i*1.618*sin(angle)
        y = i*1.618*cos(angle)
        ellipse(centerX+x,centerY+y,data[i]/4,data[i]/4)
        ellipse(centerX+2*x,centerY+2*y,data[i]/4,data[i]/4)
      
def filter(data):
    for i in range(1,XRES-1):
        data[i]=0.5*(data[i-1] + data[i+1])
                          
      
def draw():
    filter(randata)
    if (2*frameCount)<(2000):
        plot(randata, 2*frameCount)
------------------------------------------------------------------------------------------------------------------

I thought I should have gone back a bit with the amount of circles as well as the radius.
Comment : Much smaller black center, the rings out side is clearly shaped. The outcome is awesome, I like it.

CODE :
------------------------------------------------------------------------------------------------------------------
 import math

XRES = 600
YRES = 400
centerX = random(XRES/2,XRES-200)
centerY = random(YRES/2,YRES-200)

def setup():
    size(XRES, YRES)
    background(255)
    noStroke()
    fill(0,0,0,80)
    smooth()
  
randata = []
for i in range(XRES):
    randata = randata + [random(-150.,150.)]
  
def plot(data, yoff):
    for i in range(1, XRES):
        angle = random(0.,PI*2)
        x = i*1.618*sin(angle)
        y = i*1.618*cos(angle)
        ellipse(centerX+x,centerY+y,data[i]/5,data[i]/5)
        ellipse(centerX+2*x,centerY+2*y,data[i]/7,data[i]/7)
      
def filter(data):
    for i in range(1,XRES-1):
        data[i]=0.5*(data[i-1] + data[i+1])
                      
      
def draw():
    filter(randata)
    if (4*frameCount)<(2000):
        plot(randata, 4*frameCount)
------------------------------------------------------------------------------------------------------------------ 

I just found the problem I got here was the center of my galaxy just randomly placed to the right of the sketch. So I tried to figure out the way to make this right. Putting a negative number in the random in the sketch would help. Also I tweaked the size of the sketch to get more stars in a sketch, I thought it would be more interesting though.

Comment : The ring is random as well. However the ring is pleasure to me already.

CODE :
------------------------------------------------------------------------------------------------------------------
 import math

XRES = 900
YRES = 700
centerX = random(XRES/2,XRES-200)
centerY = random(YRES/2,YRES-200)

def setup():
    size(XRES, YRES)
    background(255)
    noStroke()
    fill(0,0,0,80)
    smooth()
  
randata = []
for i in range(XRES):
    randata = randata + [random(-150.,150.)]
  
def plot(data, yoff):
    for i in range(1, XRES):
        angle = random(0.,PI*2)
        x = i*1.618*sin(angle)
        y = i*1.618*cos(angle)
        ellipse(centerX+x,centerY+y,data[i]/5,data[i]/5)
        ellipse(centerX+2*x,centerY+2*y,data[i]/7,data[i]/7)
      
def filter(data):
    for i in range(1,XRES-1):
        data[i]=0.5*(data[i-1] + data[i+1])
                          
      
def draw():
    filter(randata)
    if (4*frameCount)<(2500):
        plot(randata, 4*frameCount)
------------------------------------------------------------------------------------------------------------------

TRIALS WITH HARDER FILTER AND RANDOM IN CIRCLE

I stepped one more step to more complicated codes like random in circle and more advanced filtered random.

 Comment : The outcome is great, so random and fulfill. More interesting with these codes.
CODE :
------------------------------------------------------------------------------------------------------------------
import math

XRES = 600
YRES = 400
centerX = XRES/2
centerY = YRES/2
npts = 400

def setup():
    size(XRES, YRES)
    background(255)
    stroke(0)
    smooth()
   
randata = []
for i in range(XRES):
    randata = randata + [random(-100.,100.)]
   
def plot(data, yoff):
    for i in range(1, XRES):
        angle = PI*2
        x = i*1.618*sin(angle)
        y = i*1.618*cos(angle)
        line(x,y,i,yoff+data[i])
       
def filter(data):
    for i in range(1,XRES-1):
        data[i]=0.9*(data[i-1] + data[i+1])
                           
       
def draw():
    filter(randata)
    if (40*frameCount)<(YRES+200):
        plot(randata, 40*frameCount)
------------------------------------------------------------------------------------------------------------------

Then I tried smaller amount on filtering like (0.5-0.6) the multiply the frameCount with 50.
 Comment : The outcome is much crazier. The lines are filling all the blank on the sketch, and making really crazy net.
CODE :
------------------------------------------------------------------------------------------------------------------
 import math

XRES = 600
YRES = 400
centerX = XRES/2
centerY = YRES/2
npts = 400

def setup():
    size(XRES, YRES)
    background(255)
    stroke(0)
    smooth()
  
randata = []
for i in range(XRES):
    randata = randata + [random(-100.,100.)]
  
def plot(data, yoff):
    for i in range(1, XRES):
        angle = random(0.,PI*2)
        x = i*1.618*sin(angle)
        y = i*1.618*cos(angle)
        line(centerX+x,centerY+y,i/250,yoff+data[i])
      
def filter(data):
    for i in range(1,XRES-1):
        data[i]=0.5*(data[i-1] + data[i+1])
                      
      
def draw():
    filter(randata)
    if (50*frameCount)<(YRES+200):
        plot(randata, 50*frameCount)
------------------------------------------------------------------------------------------------------------------

The previous trial was crazy, but that with lines I wonder why not using ellipse shapes?
 Comment : This is an amazing outcome. Circles by circles, somehow I felt like I was 10k feet under the water where lots of bubbles surrounding me.
CODE :
------------------------------------------------------------------------------------------------------------------
 import math

XRES = 600
YRES = 400
centerX = XRES/2
centerY = YRES/2
npts = 400

def setup():
    size(XRES, YRES)
    background(255)
    stroke(0)
    smooth()
  
randata = []
for i in range(XRES):
    randata = randata + [random(-100.,100.)]
  
def plot(data, yoff):
    for i in range(1, XRES):
        angle = random(0.,PI*2)
        x = i*1.618*sin(angle)
        y = i*1.618*cos(angle)
        ellipse(centerX+x,centerY+y,data[i],data[i])
      
def filter(data):
    for i in range(1,XRES-1):
        data[i]=0.5*(data[i-1] + data[i+1])
                      
      
def draw():
    filter(randata)
    if (50*frameCount)<(YRES+200):
        plot(randata, 50*frameCount)
------------------------------------------------------------------------------------------------------------------

MORE UNDERSTANDING ON CODES

I got some ideas how these codes works, so I started to tweak as my pleasant.
At the very first, I tried with filtered random, tried to fix some numbers to get more interesting results.

 Comment :  Crazy waves caused from filter and random. Interesting.
CODE :
------------------------------------------------------------------------------------------------------------------
XRES = 600
YRES = 400

def setup():
    size(XRES, YRES)
    background(255)
    stroke(0)
    smooth()
   
randata = []
for i in range(XRES):
    randata = randata + [random(-50.,150.)]
   
def plot(data, yoff):
    for i in range(1, XRES):
        line(i-1,yoff+data[i-1],i,yoff+data[i])
       
def filter(data):
    for i in range(1,XRES-1):
        data[i]=0.5*(data[i-1] + data[i+1])
       
def draw():
    filter(randata)
    if (4*frameCount)<(YRES+100):
        plot(randata, 4*frameCount)
------------------------------------------------------------------------------------------------------------------

What if I tried with another shapes instead of using lines? Here with the circles
Comment : Looks crazy, I love this.
 CODE :
------------------------------------------------------------------------------------------------------------------
 XRES = 600
YRES = 400

def setup():
    size(XRES, YRES)
    background(255)
    stroke(0)
    smooth()
  
randata = []
for i in range(XRES):
    randata = randata + [random(-200.,200.)]
  
def plot(data, yoff):
    for i in range(1, XRES):
        ellipse(i-1,yoff+data[i-1],i,yoff+data[i])
      
def filter(data):
    for i in range(1,XRES-1):
        data[i]=0.5*(data[i-1] + data[i+1])
                          
      
def draw():
    filter(randata)
    if (40*frameCount)<(YRES+100):
        plot(randata, 40*frameCount)
------------------------------------------------------------------------------------------------------------------
And trial with rectangle

Comment : Hierarchy indeed, but not my types of art. Good trial to understand more on codes though.
CODE :
------------------------------------------------------------------------------------------------------------------
 XRES = 600
YRES = 400

def setup():
    size(XRES, YRES)
    background(255)
    stroke(0)
    smooth()
  
randata = []
for i in range(XRES):
    randata = randata + [random(-200.,200.)]
  
def plot(data, yoff):
    for i in range(1, XRES):
        rect(i-1,yoff+data[i-1],i,yoff+data[i])
      
def filter(data):
    for i in range(1,XRES-1):
        data[i]=0.5*(data[i-1] + data[i+1])
                      
      
def draw():
    filter(randata)
    if (40*frameCount)<(YRES+100):
        plot(randata, 40*frameCount)
------------------------------------------------------------------------------------------------------------------

EXAMPLES BY EXAMPLES

I was bit slow at understanding all of the random codes, so I tried almost the examples from the "random" lecture PDF files.
Example 1 :
Comment : In linear form, the simplest one.
CODE :
-----------------------------------------------------------------------------------------------------------------
XRES = 600
YRES = 600
CX = XRES/2
CY = YRES/2
npts = 5000

import math

def setup():
    size(XRES,YRES)
    background(255)
    stroke(0,10)
    smooth()
    noLoop()
   
def draw():
    for i in range(npts):
        r = CX + random(-200,200)
        line(r,CY-100,r,CY+100)
-----------------------------------------------------------------------------------------------------------------

Example 2 :
Comment : Just applied list in and get a slightly different result from the first one.
CODE :
-----------------------------------------------------------------------------------------------------------------
 XRES = 600
YRES = 600
CX = XRES/2
CY = YRES/2
npts = 5000

buckets = [0.]
buckets = buckets*XRES

def setup():
    size(XRES, YRES)
    background(255)
    stroke(0,10)
    smooth()
    noLoop()
  
def draw():
    for i in range(npts):
        r = CX + random(-200,200)
        line(r,CY-100,r,CY+100)
        ir = int(r)
        buckets[ir] = buckets[ir] + 1
      
    stroke(0)
    for i in range (XRES):
        line(i,CY-200,i,CY-200-buckets[i])
-----------------------------------------------------------------------------------------------------------------

Example 3 :
Comment : Still the same as the second one but with a gradient effect.
CODE :
-----------------------------------------------------------------------------------------------------------------
 XRES = 600
YRES = 600
CX = XRES/2
CY = YRES/2
npts = 5000

buckets = [0.]
buckets = buckets*XRES

def setup():
    size(XRES, YRES)
    background(255)
    stroke(0,10)
    smooth()
    noLoop()
  
def draw():
    for i in range(npts):
        r = CX
        for j in range(12): r = r + random(-50,50)
        line(r,CY-100,r,CY+100)
      
    stroke(0)
    for i in range(XRES):
        line(i, CY-200, i, CY-200-buckets[i])
----------------------------------------------------------------------------------------------------------------- 


THE VERY FIRST TRIAL

I used the example from the lecture to start off my project 2. The "Random bugs", I tried to understand the codes though.
Comment : simple but really effective. Furthermore, the random source comes from the center.
CODE
---------------------------------------------------------------------------------------------------------------
import math
import random

def rnd11():
    return 2.*random.random()-1.
   
SIZE = 600
xpos = SIZE/2.
ypos = SIZE/2.

def setup():
    global xpos,ypos
    size(SIZE, SIZE)
    smooth()
    fill(0,0,0,1)
    background(255)
   
def draw():
    global xpos, ypos
    rect(xpos,ypos,1,1)
    xpos = xpos + rnd11()
    ypos = ypos + rnd11()
---------------------------------------------------------------------------------------------------------------

Wednesday 28 March 2012

FINAL SUBMISSION - Project 1

Tweak a little bit more, one more circle draw function.... so much more interesting outcome... LOVE IT!

Smoother version (in video format) PLEASE WATCH IN 720

CODE :
++++++++++++++++++++++++++++++++++++++++++++++++++++++++++++++++++++++++++ 
import math ##import math library

cx = 400.
cy = 400.
rad = 300.

##define 'colors' list
colors = range(5)
colors[0] = color(10,58,74,150)
colors[1] = color(25,106,115,150)
colors[2] = color(50,166,166,150)
colors[3] = color(161, 191, 51,150)
colors[4] = color(200, 217, 74, 150)

def setup():              ##setup the sketch
    size(800, 800)
    stroke(255)         ##white stroke
    smooth()             ##smoother graphic
    frameRate(100)

def draw():                                                ##draw on the sketch
    background(240)                                  ##almost white colour, refresh sketch
    time = millis()/9000.                              ##change through time
    x = (float)(cx+rad*math.cos(time))        ##position X
    y = (float)(cy+rad*math.sin(time))         ##positin Y
                                                                ##color changer | change through positionY
    if (y<=200.):
        rc = colors[0]
    if (y>200.) and (y<=400.):
        rc = colors[2]
    if (y>400.) and (y<=600.):
        rc = colors[3]
    if (y>600.) and (y<=800.):
        rc = colors[4]
    fill(rc)
    for i in range(1, 800):                     ##loop i = 1->799
        angle = y + i/2.01                      ##angle based on position Y
                                                         ##increase i for distance between spirals
        transX = i * 1.618 * math.pow(math.sin(angle),1)      ##Xtranslation
        transY = i * 1.618 * math.pow(math.cos(angle),1)     ##Ytranslation
        width = math.pow(i, -1)                                                      ##can use sin or cos(whatever)
        ellipse(x+transX, y+transY, width+i*0.39, width+i*0.39)    ##width+i*... = amplify number(big or small)
        ellipse(x-transX, y-transY, width+i*0.2, width+i*0.2)
++++++++++++++++++++++++++++++++++++++++++++++++++++++++++++++++++++++++++

FINAL DEVELOPED!

I chose the very last development as my final one. So need to simplify for much clearer coding.


SIMPLIFIED, COMMENTED AND MUCH MUCH CLEARER CODE
=-=-=-=-=-=-=-=-=-=-=-=-=-=-=-=-=-=-=-=-=-=-=-=-=-=-=-=-=-=-=-=-=-=-=-=-=-=-=-=-=-=-=-=-=-=
import math               ##import math library

cx = 400.
cy = 400.
rad = 300.

##define 'colors' list
colors = range(5)
colors[0] = color(10,58,74,150)
colors[1] = color(25,106,115,150)
colors[2] = color(50,166,166,150)
colors[3] = color(161, 191, 51,150)
colors[4] = color(200, 217, 74, 150)

def setup():              ##setup the sketch
    size(800, 800)
    stroke(255)         ##white stroke
    smooth()             ##smoother graphic
    frameRate(100)

def rcfunction():        ##random colours function
    if (mouseY<=200):
        rc = colors[0]
    if (mouseY>200) and (mouseY<=400):
        rc = colors[2]
    if (mouseY>400) and (mouseY<=600):
        rc = colors[3]
    if (mouseY>600) and (mouseY<=800):
        rc = colors[4]
    fill(rc)

def draw():                                                     ##draw on the sketch
    background(240)                                       ##almost white colour, refresh sketch
    time = millis()/9000.                                   ##change through time
    x = (float)(cx+rad*math.cos(time))            ##position X
    y = (float)(cy+rad*math.sin(time))             ##positin Y
    ##color changer | change through positionY
    if (y<=200.):
        rc = colors[0]
    if (y>200.) and (y<=400.):
        rc = colors[2]
    if (y>400.) and (y<=600.):
        rc = colors[3]
    if (y>600.) and (y<=800.):
        rc = colors[4]
    fill(rc)
    for i in range(1, 800):                               ##loop i = 1->799
        angle = y + i/2.01                                ##angle based on position Y
                                                                    ##increase i for distance between spirals
        transX = i * 1.618 * math.pow(math.sin(angle),1)                ##Xtranslation
        transY = i * 1.618 * math.pow(math.cos(angle),1)              ##Ytranslation
        width = math.pow(i, -1)                                                      ##can use sin or cos(whatever)
        ellipse(x+transX, y+transY, width+i*0.39, width+i*0.39)    ##width+i*... = amplify number(big or small)
=-=-=-=-=-=-=-=-=-=-=-=-=-=-=-=-=-=-=-=-=-=-=-=-=-=-=-=-=-=-=-=-=-=-=-=-=-=-=-=-=-=-=-=-=

ONE STEP BACK AND RESTART!

I went back the development I did before, the spiral, tornado-like circle... going on developing

Comment : The thickness and depth are increased. Love the spiral so much. So flexible, so soft, bubble, bubble liked.

CODE :
---------------------------------------------------------------------------------------------------------------
import math

def setup():
    size(800,800)
    stroke(255)
    smooth()
   
colors = range(5)
colors[0] = color(10,58,74,150)
colors[1] = color(25,106,115,150)
colors[2] = color(50,166,166,150)
colors[3] = color(161, 191, 51,150)
colors[4] = color(200, 217, 74, 150)

def rcfunction():
    if (mouseY<=200):
        rc = colors[0]
    if (mouseY>200) and (mouseY<=400):
        rc = colors[2]
    if (mouseY>400) and (mouseY<=600):
        rc = colors[3]
    if (mouseY>600) and (mouseY<=800):
        rc = colors[4]
    fill(rc)

       
def draw():
    background(240)
    rcfunction()
    for ii in range (1,800):
        trans = mouseY + ii
        xx = ii * 3.14 * math.pow(math.sin(trans),1%2)
        yy = ii * 3.14 * math.pow(math.cos(trans),1%2)
        width = math.pow(ii, -25)
        ellipse(mouseX+xx, mouseY+yy, width+ii*0.8, width+ii*0.8)
---------------------------------------------------------------------------------------------------------------

MORE DEVELOPMENTS!

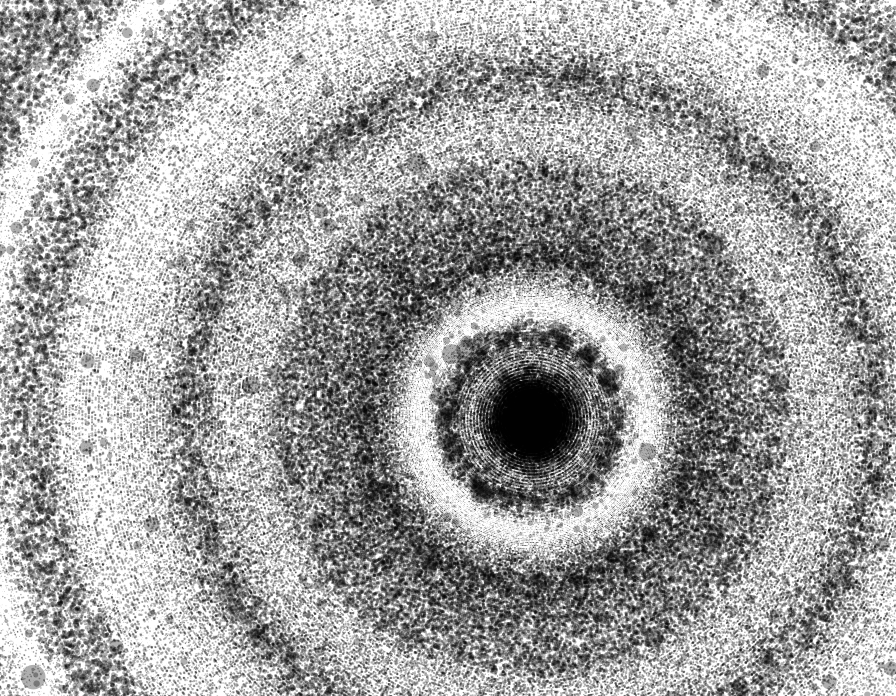
I now try to differentiate the colours through mouse's coordinate.... developed from the colours list I had tried before... also function IF is used


Comment : White for background, also I combined the alpha into colours so made the opacity lower for more transparency effect. I love this outcome, so elegant, flexible and kind of chaotic.

CODE :
--------------------------------------------------------------------------------------------------------------------------------------
import math

def setup():
    size(800,800)
    stroke(255)
    smooth()
   
colors = range(5)
colors[0] = color(10,58,74,150)
colors[1] = color(25,106,115,150)
colors[2] = color(50,166,166,150)
colors[3] = color(161, 191, 51,150)
colors[4] = color(200,217,74,150)

def rcfunction():
    if (mouseY>100) :
        rf = colors[0]
    if (mouseY>200):
        rf = colors[1]
    if (mouseY>300):
        rf = colors[2]
    if (mouseY>400):
        rf = colors[3]
    if (mouseY<101):
        rf = colors[int(random(0,1))]
    fill(rf)
                   
       
def draw():
    background(250)
    for i in range(1,600,2):
        angle = mouseX * i * 0.001
        x = i * 3.14 * math.sin(angle)
        y = i * 3.14 * math.cos(angle)
        width = math.pow(i, -2)
        rcfunction()
        ellipse(mouseX+x, mouseY+y, width+i*0.8, width+i*0.8)
---------------------------------------------------------------------------------------------------------------


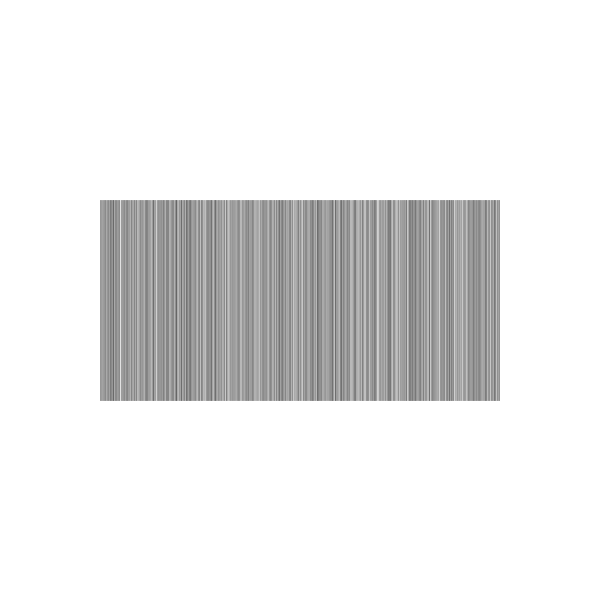
Comment : Change a little bit, move more chaotically, randomly move forward then backward. This is the way I preferred

CODE :
---------------------------------------------------------------------------------------------------------------
import math

def setup():
    size(800,800)
    stroke(255)
    smooth()
   
colors = range(5)
colors[0] = color(10,58,74,150)
colors[1] = color(25,106,115,150)
colors[2] = color(50,166,166,150)
colors[3] = color(161, 191, 51,150)
colors[4] = color(200, 217, 74, 150)

def rcfunction():
    if (mouseY<=200):
        rc = colors[0]
    if (mouseY>200) and (mouseY<=400):
        rc = colors[2]
    if (mouseY>400) and (mouseY<=600):
        rc = colors[3]
    if (mouseY>600) and (mouseY<=800):
        rc = colors[4]
    fill(rc)
                   
       
def draw():
    background(240)
    for i in range(1,600,2):
        angle = mouseX * i * 0.001
        x = i * 3.14 * math.sin(angle)
        y = i * 3.14 * math.cos(angle)
        width = math.pow(i, -2)
        rcfunction()
        ellipse(mouseX+x, mouseY+y, width+i*0.8, width+i*0.8)
---------------------------------------------------------------------------------------------------------------


Comment : Tried draw more shapes like squares, nothing really change. The outcome is just for fun but still significant to get refreshed

CODE :
---------------------------------------------------------------------------------------------------------------
import math

def setup():
    size(800,800)
    stroke(255)
    smooth()
   
colors = range(5)
colors[0] = color(10,58,74,150)
colors[1] = color(25,106,115,150)
colors[2] = color(50,166,166,150)
colors[3] = color(161, 191, 51,150)
colors[4] = color(200, 217, 74, 150)

def rcfunction():
    if (mouseY<=200):
        rc = colors[0]
    if (mouseY>200) and (mouseY<=400):
        rc = colors[2]
    if (mouseY>400) and (mouseY<=600):
        rc = colors[3]
    if (mouseY>600) and (mouseY<=800):
        rc = colors[4]
    fill(rc)
                   
       
def draw():
    background(240)
    for i in range(1,600,2):
        angle = mouseX * i * 0.001
        x = i * 3.14 * math.sin(angle)
        y = i * 3.14 * math.cos(angle)
        width = math.pow(i, -2)
        rcfunction()
        ellipse(mouseX+x, mouseY+y, width+i*0.8, width+i*0.8)
        rect(mouseX+y, mouseY+x, width+i*0.2, width+i*0.2)
        rect(mouseX+y, mouseY+x, width+i*0.6-100, width+i*0.6-100)
---------------------------------------------------------------------------------------------------------------
Go back and test with PI or 2PI, also applied power into math function.... going to get new ideas!

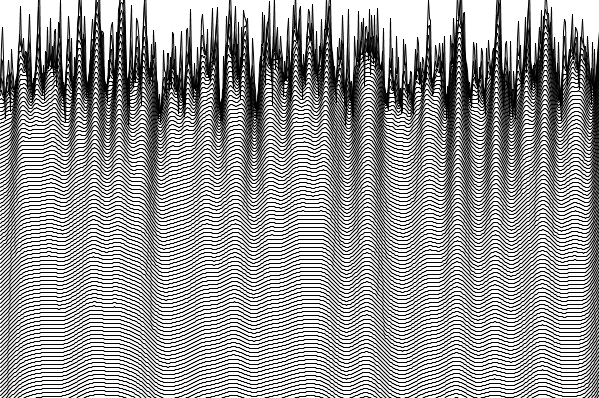
 Comment : Spiral ladder thingy! Amazing, the movement is exactly wave-liked. I like it so much, but it kind of impossible to fill all the sketch, somehow I still felt so blank. Anyway, still a good trial though.

CODE :
---------------------------------------------------------------------------------------------------------------
import math

def setup():
    size(800,800)
    stroke(255)
    smooth()
   
colors = range(5)
colors[0] = color(10,58,74,150)
colors[1] = color(25,106,115,150)
colors[2] = color(50,166,166,150)
colors[3] = color(161, 191, 51,150)
colors[4] = color(200, 217, 74, 150)

def rcfunction():
    if (mouseY<=200):
        rc = colors[0]
    if (mouseY>200) and (mouseY<=400):
        rc = colors[2]
    if (mouseY>400) and (mouseY<=600):
        rc = colors[3]
    if (mouseY>600) and (mouseY<=800):
        rc = colors[4]
    fill(rc)

       
def draw():
    background(240)
    rcfunction()
    for ii in range (1,800):
        trans = mouseY + ii
        xx = ii * 6.28 * math.pow(math.sin(trans),2)
        yy = ii * 6.28 * math.pow(math.cos(trans),2)
        width = math.pow(ii, -25)
        ellipse(mouseX+xx, mouseY+yy, width+ii*0.8, width+ii*0.8)
---------------------------------------------------------------------------------------------------------------
The rest is so blank... What can I do?! Tried to keep going...
Here another try:
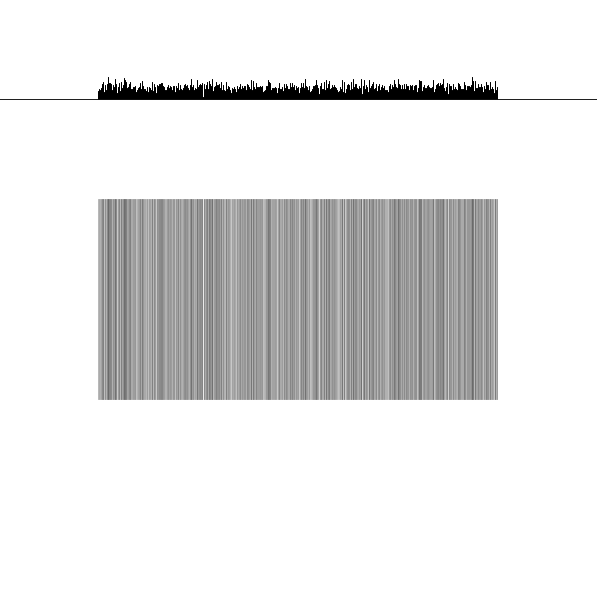
 Comment : tried 2 loops, more sin & cos functions. The outcome is magnificent, it is so cool. The problem is it is so hard to get things a little bit in order, I don't know it is felt like unordered.

CODE :
---------------------------------------------------------------------------------------------------------------
import math

def setup():
    size(800,800)
    stroke(255)
    smooth()
   
colors = range(5)
colors[0] = color(10,58,74,150)
colors[1] = color(25,106,115,150)
colors[2] = color(50,166,166,150)
colors[3] = color(161, 191, 51,150)
colors[4] = color(200, 217, 74, 150)

def rcfunction():
    if (mouseY<=200):
        rc = colors[0]
    if (mouseY>200) and (mouseY<=400):
        rc = colors[2]
    if (mouseY>400) and (mouseY<=600):
        rc = colors[3]
    if (mouseY>600) and (mouseY<=800):
        rc = colors[4]
    fill(rc)

       
def draw():
    background(240)
    rcfunction()
    for i in range(1,600,2):
        angle = mouseX * i * 0.001
        x = i * 3.14 * math.sin(angle)
        y = i * 3.14 * math.cos(angle)
        width = math.pow(i, -2)
        ellipse(mouseX+x, mouseY+y, width+i*0.2, width+i*0.2)
        rect(mouseX+y, mouseY+x, width+i*0.2, width+i*0.2)
        rect(mouseX+y, mouseY+x, width+i*0.2-10, width+i*0.2-10)
    for ii in range (1,800):
        trans = mouseY + ii
        xx = ii * 6.28 * math.pow(math.sin(trans),2)
        yy = ii * 6.28 * math.pow(math.cos(trans),2)
        width = math.pow(ii, -25)
        ellipse(mouseX+xx, mouseY+yy, width+ii*0.8, width+ii*0.8)
---------------------------------------------------------------------------------------------------------------

PARTICULAR POST FOR COLOUR PALETTE

I did post in the previous development process post, but for more attention I made a particular post here for the colour palette
I used kuler.com (colours by charlottebowie)
link : http://kuler.adobe.com/#themes/search?term=userId%3A701264

DEVELOPMENT - TRY, TRY AND TRY

Still applied sin, cos wave and golden ratio... Test out lots of outcomes
Here I tried with shape like circle, no lines any more.


Comment : keep the grey and white colours. Changed the shape into circle, applied sin, cos and golden ratio
The outcome is look liked a spiral wave or a tornado, so cool then.
CODE :
---------------------------------------------------------------------------------------------------------------
import math                                      

def setup():
    size(600,600)
    background(150)
    stroke(255)
    smooth()

def draw():
    background(150)
    for i in range(1,500,20):
        angle = mouseY * i * 0.001
        x = i * 1.61803399 * math.sin(angle)
        y = i * 1.61803399 * math.cos(angle)
        width = 0.00001
        ellipse(300+x, 300+y, width+i, width+i)
---------------------------------------------------------------------------------------------------------------
Make the circles appear more frequently
CODE :
---------------------------------------------------------------------------------------------------------------
import math

def setup():
    size(600,600)
    background(150)
    stroke(255)
    smooth()

def draw():
    background(150)
    for i in range(1,500,2):
        angle = mouseY * i * 0.001
        x = i * 1.61803399 * math.sin(angle)
        y = i * 1.61803399 * math.cos(angle)
        width = math.pow(2, -10)
        ellipse(300+x, 300+y, width+i, width+i)
---------------------------------------------------------------------------------------------------------------
Different colours fill and stroke.... FOR THE EXPERIENCE!
Comment : The result is flexible, contrast and amazing. I love it! But still the long way to my final
CODE :
---------------------------------------------------------------------------------------------------------------
import math

def setup():
    size(600,600)
    background(150)
    stroke(255)
    smooth()

def draw():
    background(150)
    for i in range(1,500,2):
        angle = mouseY * i * 0.001
        x = i * 1.61803399 * math.sin(angle)
        y = i * 1.61803399 * math.cos(angle)
        width = math.pow(2, -10)
        fill(255,0,0,50)
        ellipse(300+x, 300+y, width+i, width+i)
---------------------------------------------------------------------------------------------------------------
Tried frameRate function to smoother the animation, use 2PI formula to get some interesting results.
Also why not testing with interacting with 2 axis of mouse coordinate.

Comment : kind of pleasant result, more flexible but I felt like it lacks of something, a little bit blankly. Also tried distinguish the functions for more effects with if... etc

CODE :
---------------------------------------------------------------------------------------------------------------
import math

def setup():
    size(600,600)
    background(150)
    stroke(255)
    smooth()
    frameRate(1000000)

def draw():
    background(150)
    for i in range(1,500,1):
        angle = mouseX * i * 0.01
        x = i * 6.28 * math.sin(angle)
        y = i * 6.28 * math.cos(angle)
        width = math.pow(2, -100)
        fill(255,0,0,50)
        if mouseX<300 :
            ellipse(mouseX+x, mouseY+y, width+i, width+i)
        else :
            ellipse(mouseY+x, mouseX+y, width+i, width+i)
---------------------------------------------------------------------------------------------------------------
More developments' coming
Comment : I watch and learn to make a list in http://www.khanacademy.org/science/computer-science/v/python-lists. So I tried it out right away, but where can I put it in?! I tested with the colours and also used random function to get more variable on colours. The only problems was the colours changing process too fast. Also I referenced the colours palette from kuler.com
Link here & shot : http://kuler.adobe.com/#themes/search?term=userId%3A701264

CODE I USED :
---------------------------------------------------------------------------------------------------------------
import math
   
def setup():
    size(600,600)
    stroke(255)
    smooth()
   
colors = range(5)
colors[0] = color(10,58,74)
colors[1] = color(25,106,115)
colors[2] = color(50,166,166)
colors[3] = color(161, 191, 51)
colors[4] = color(200,217,74)

def draw():
    background(50,166,166)
    for i in range(1,500,1):
        angle = mouseX * i * 0.01
        x = i * 6.28 * math.sin(angle)
        y = i * 6.28 * math.cos(angle)
        width = math.pow(2, -100)
        rf = (colors[int(random(0,4))])
        fill(rf)
        if mouseX<300 :
            ellipse(mouseX+x, mouseY+y, width+i, width+i)
        else :
            ellipse(mouseY+x, mouseX+y, width+i, width+i)
---------------------------------------------------------------------------------------------------------------

DEVELOPMENTS ON PREVIOUS TRIALS

I manage to develop more and more to get more exciting result that I would love.
Comment : tweak some values in the previous code, the shape is slightly different. The outcome is still good, but nothing different.
CODE :
---------------------------------------------------------------------------------------------------------------
import math

def setup():
    size(1200,1200)
    background(255)
    stroke(0)
    smooth()

def Xfunction(z):
    return 300.*math.cos(1.6180339887*z)
   
def Yfunction(z):
    return 300.*math.sin(6.28*z)
   
   
def draw():
    background(255)
    for i in range(1, 1200.):
        z = i / 200.
        angle = mouseX*i*0.01
        trans = mouseY+i%5000
        lx = Xfunction(0.) + trans
        ly = Yfunction(0.) + trans
        x = Xfunction(z) + angle
        y = Yfunction(z) + angle
         line(lx, ly, x, y)
        line(ly, lx, y, x)
        lx = x
        ly = y
---------------------------------------------------------------------------------------------------------------

Tweak the value again, now is another different result but the style is kept
Comment : Preferred style, blossoming-flower-liked  look.
CODE :
---------------------------------------------------------------------------------------------------------------
import math

def setup():
    size(1200,1200)
    background(255)
    stroke(0)
    smooth()

def Xfunction(z):
    return 300.*math.cos(1.6180339887*z)
   
def Yfunction(z):
    return 300.*math.cos(6.28*z)
   
   
def draw():
    background(255)
    for i in range(1, 1200.):
        z = i / 200.
        angle = mouseX*i*0.01
        trans = mouseY+i%5000
        lx = Xfunction(0.) + trans
        ly = Yfunction(0.) + trans
        x = Xfunction(z) + angle
        y = Yfunction(z) + angle
         line(lx, ly, x, y)
        line(ly, lx, y, x)
---------------------------------------------------------------------------------------------------------------

Still playing around by mouse, but I managed to create another new code, would be change the result significantly.

 Comment : I was "Wow, amazing". But later I felt somehow too complicated and confused. But yes, another good trial. Also I tried to change the colour style (grey & white) for more experimenting.

CODE :
---------------------------------------------------------------------------------------------------------------
import math

def setup():
    size(600,600)
    background(150)
    stroke(255)
    smooth()

def draw():
    background(150)
    for i in range(500):
        angle = mouseY * i
        x = i * 1.61803399 * math.sin(angle)
        y = i * 1.61803399 * math.cos(angle)
        width = 1
        line(300+x, 300+y, width+i, width+i)
---------------------------------------------------------------------------------------------------------------

ON THE WAY STARTING OFF

I tried the code in lecture files to play around with mouse and create some cool effects.
CODE :
---------------------------------------------------------------------------------------------------------------
import math

def setup():
    size(600, 600)
    background(255)
    stroke(0)
    smooth()
   
def draw():
    for i in range (500):
        angle = mouseX * i
        x = i * 6.28 * math.cos(angle)
        y = i * 6.28 * math.sin(angle)
        width = 1
        rect(300+x, 300+y, width+i, width+i)
---------------------------------------------------------------------------------------------------------------
Comment :  the changes and movements are based on the mouse's X-coordinate
The result is impressive, provided 3D look.

From that, I tried to create my own one, still based on mouse's X-coordinate
CODE :
---------------------------------------------------------------------------------------------------------------
import math

def setup():
    size(600,600)
    background(255)
    stroke(0)
    smooth()

def Xfunction(z):
    return 300.*math.cos(1.6180339887*z)
   
def Yfunction(z):
    return 300.*math.sin(3.14*z)
   
   
def draw():
    background(255)
    lx = Xfunction(0.) + 300
    ly = Yfunction(0.) + 300
    for i in range(1, 600.):
        z = i / 10.
        angle = mouseX*i
        x = Xfunction(z) + angle
        y = Yfunction(z) + angle
         line(lx, ly, x, y)
        line(ly, lx, y, x)
        lx = x
        ly = y
---------------------------------------------------------------------------------------------------------------
Comment : The result is unexpected but still my first shot. Also I applied a golden ratio here.

Again, I tried something newer
Comment : I tried bigger sketch (1200x1200), also tried something deal with the mouse's Y-coordinate( here it changed the frequency of the lines appear in the sketch)
The outcome is magnificent, in fluid-form, flexible.

 CODE :
---------------------------------------------------------------------------------------------------------------
import math
   
def setup():
    size(1200,1200)
    background(255)
    stroke(0)
    smooth()

def Xfunction(z):
    return 300.*math.cos(1.6180339887*z)
   
def Yfunction(z):
    return 300.*math.sin(6.28*z)
   
   
def draw():
    background(255)
    for i in range(1, 1200.):
        z = i / 200.
        angle = mouseX*i*0.01
        trans = mouseY+i%5
        lx = Xfunction(0.) + trans
        ly = Yfunction(0.) + trans
        x = Xfunction(z) + angle
        y = Yfunction(z) + angle
         line(lx, ly, x, y)
        line(ly, lx, y, x)
        lx = x
        ly = y
---------------------------------------------------------------------------------------------------------------