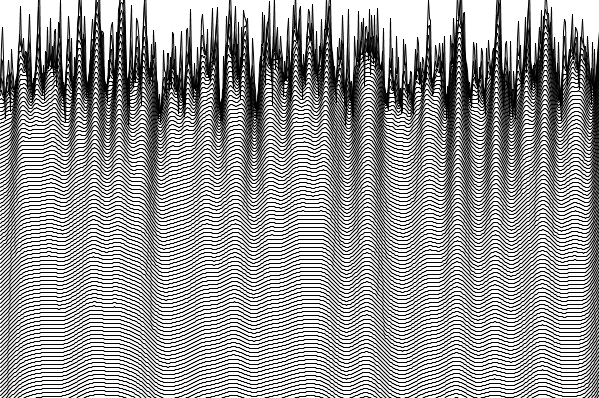
At the very first, I tried with filtered random, tried to fix some numbers to get more interesting results.
CODE :
------------------------------------------------------------------------------------------------------------------
XRES = 600
YRES = 400
def setup():
size(XRES, YRES)
background(255)
stroke(0)
smooth()
randata = []
for i in range(XRES):
randata = randata + [random(-50.,150.)]
def plot(data, yoff):
for i in range(1, XRES):
line(i-1,yoff+data[i-1],i,yoff+data[i])
def filter(data):
for i in range(1,XRES-1):
data[i]=0.5*(data[i-1] + data[i+1])
def draw():
filter(randata)
if (4*frameCount)<(YRES+100):
plot(randata, 4*frameCount)
------------------------------------------------------------------------------------------------------------------
What if I tried with another shapes instead of using lines? Here with the circles

CODE :
------------------------------------------------------------------------------------------------------------------
XRES = 600
YRES = 400
def setup():
size(XRES, YRES)
background(255)
stroke(0)
smooth()
randata = []
for i in range(XRES):
randata = randata + [random(-200.,200.)]
def plot(data, yoff):
for i in range(1, XRES):
ellipse(i-1,yoff+data[i-1],i,yoff+data[i])
def filter(data):
for i in range(1,XRES-1):
data[i]=0.5*(data[i-1] + data[i+1])
def draw():
filter(randata)
if (40*frameCount)<(YRES+100):
plot(randata, 40*frameCount)
------------------------------------------------------------------------------------------------------------------
And trial with rectangle

Comment : Hierarchy indeed, but not my types of art. Good trial to understand more on codes though.
CODE :
------------------------------------------------------------------------------------------------------------------
XRES = 600
YRES = 400
def setup():
size(XRES, YRES)
background(255)
stroke(0)
smooth()
randata = []
for i in range(XRES):
randata = randata + [random(-200.,200.)]
def plot(data, yoff):
for i in range(1, XRES):
rect(i-1,yoff+data[i-1],i,yoff+data[i])
def filter(data):
for i in range(1,XRES-1):
data[i]=0.5*(data[i-1] + data[i+1])
def draw():
filter(randata)
if (40*frameCount)<(YRES+100):
plot(randata, 40*frameCount)
------------------------------------------------------------------------------------------------------------------
No comments:
Post a Comment